November 21, 2025
Hon. Walter Alcorn
Chair, National Capital Region Transportation Planning Board
Re: Comments on draft Visualize 2050 long-range plan
Chair Alcorn and TPB board members:
The Coalition for Smarter Growth submits these comments on the draft regional long-range transportation plan Visualize 2050. We appreciate the hard work of TPB, state and local staff.
Summary:
We appreciate the new early public comment period in 2023 and some positive changes, but overall Visualize 2050 does not meet Board resolution R19-2021
- Visualize 2050 failed to meet the intent of the TPB board when it adopted resolution R19-2021, calling for an accountable plan that would make more rapid progress in meeting adopted climate targets and other goals.
- Required project information demonstrating consistency with goals was largely missing.
- CSG appreciates the additional early public comment period, removal of some old road widening projects on the books, and the reader-friendly plan documents and project lists.
Our region would miss COG, TPB and local climate change targets by a lot under Visualize
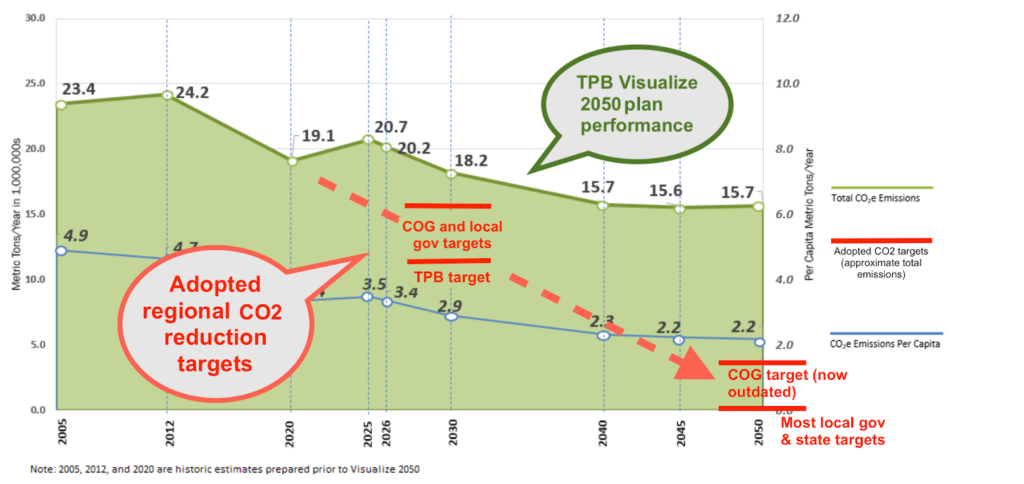
Source: TPB July 2025 presentation, with red annotations by CSG
- Due to the prioritization of road expansion over demand management, transit-oriented land use, transit and active transportation investments, Visualize 2050 falls short of the emissions reductions needed for COG’s climate targets, even with a shift to EVs.
- The Visualize 2050 plan makes no mention of climate change, and TPB has not yet followed through on work to advance greenhouse gas reduction strategies in its UPWP.
- If current USDOT guidelines suggest TPB can’t do GHG reduction work for transportation and provide accountability, then this should be moved to COG.
$20-30 billion in highway and arterial widening (500+ lane miles) and expensive new interchanges ignore induced demand and better solutions
- There are a number of good projects in the plan, but the 500+ new highway and arterial lane miles and $20-30B in highway/arterial expansion represent a misguided status quo approach. We applaud that some road widenings were removed, but too many remain.
- The plan document should include info to educate the region on induced demand.
- We appreciate that some member jurisdictions are prioritizing better solutions over car dependence, and there is more progress overall. However, as Chapter 7 acknowledges, TPB member agencies must more urgently prioritize addressing our region’s safety, affordability, and sustainability problems over counterproductive road expansion.
Public comments have repeatedly called for a change from the Visualize status quo
- 2025, 2024, 2023, 2022, and 2021 comment periods each called for less road expansion and more transit, bike, ped, local complete streets, and climate investments.
- The 2020 Voices of the Region representative survey of the region also showed similar results for what residents want future transportation investments to prioritize.
We thank the board for excluding the I-495 Southside widening and advancing DMVMoves
- We thank TPB for voting unanimously to exclude the 495 Southside highway widening project from Visualize 2050 and asking VDOT and MDOT to explore other options.
- CSG recognizes your good work outside of the Visualize process – the DMVMoves initiative and the Regional Roadway Safety Summit and its follow-up actions.
We respectfully request these actions:
- Advance further development of TPB’s regional greenhouse gas reduction strategies without continued delay, moving it under COG if TPB is not able to do the work.
- Ask COG to track progress toward its 2030 housing targets, in particular the location target near transit and walkable centers – critical for transportation, climate, equity.
- Educate stakeholders on induced demand in the Visualize plan document.
- Work with TPB staff to address public comments for clarifications and edits in the report.
- Review at the local and state levels, your projects and programs over the coming years based on the Visualize comments received.
More details on these comments are provided on the following pages.
Thank you for your consideration and work on the long-range plan,
Bill Pugh, AICP CTP
Transportation & Climate Director
DETAILED COMMENTS
1. Visualize 2050 did not meet the TPB board resolution for an accountable plan that makes more rapid progress in meeting adopted climate targets
1A. Visualize 2050 did not meet what the Board intended when it adopted R19-2021
Board resolution R19-2021 envisioned a new, accountable plan that would make urgent progress toward regional climate, safety and equity goals. The TPB news releases in June 2021 and July 2021 when this resolution was adopted included these statements by board members:
- “The board took a fundamentally critical vote… to set this region on a direction to truly meet effective climate change goals with regard to the transportation sector.”
- “There is consensus that the process needs to account for climate change.”
- “…requiring the board to undertake a thorough reevaluation of the projects in the plan so that it meets the region’s goals including climate change and to accelerate the schedule for the next update of the long-range transportation plan.”
There were improvements to the planning process that CSG appreciates – such as a cleaned up project database, old projects removed, and an early public comment period. However, it’s clear that the accountability to regional goals and transportation performance outcomes did not live up to the intention of R19-2021.
1B. Projects lacked required information on addressing regional goals when advertised for public comment and included in the conformity inputs
We appreciated the new public comment period that TPB held before agencies submitted projects, local meetings and engagement by Fairfax and Prince William counties, and the project changes considered. But for many projects, there was no evidence of compliance with the Board’s resolution for a Zero-based budgeting process, required consideration of scenario study findings, or required information on how projects support regional goals like greenhouse gas (GHG) reduction.
At the time projects were selected for the conformity analysis:
- Required project information on GHG reduction and TPB priorities was generally missing.
- Nearly half of the highway and arterial widening projects claimed to help the region meet its target to cut GHG emissions of cars and trucks 50% by 2030.
- TPB’s zero-based budgeting checkmark evaluation done for the conformity inputs yielded many contradictory results that CSG documented last year. For example:
- Widening the already eight-lane Chain Bridge Road through Tysons, while the area tries to become more walkable and transit-friendly, got a perfect 8 out of 8 checkmarks in meeting regional goals.
- In contrast, adding bike lanes, building a missing sidewalk and taming traffic by a middle school on Graham Park Road in Prince William only got 3 checkmarks.
- 23 road widening projects – over a third – got checkmarks from TPB for “Environmental Protection,” despite being inconsistent with TPB’s policy framework for that goal.
2. Despite a number of good projects, the 500+ new highway and arterial lane miles and 20-$30B in highway expansion represent a largely status quo approach
2A. Some planned road expansion was removed since Visualize 2045, but the region has a significant cumulative increase with recently completed highway expansion projects
CSG appreciates that member agencies (in particular on the Maryland side) removed a couple hundred miles of wasteful and/or destructive road widening projects. The reduction in new lane miles from 897 in Visualize 2045 down to 600 in Visualize 2050 represents progress.
It should be noted that part of this decrease in lane miles is due to the completion of widening megaprojects in Visualize 2045, like I-66 Outside the Beltway and various I-95 Virginia segments. Those completed new lane miles will continue to add to induced traffic, maintenance burdens, heat island impacts, loss of green infrastructure, loss of land for housing or other community needs, and loss of tax base over the next century.
2B. The plan document fails to acknowledge induced demand
A synthesis of empirical research on highway expansion and congestion concludes:
“Numerous studies have examined the effectiveness of this approach and consistently show that adding capacity to roadways fails to alleviate congestion for long because it actually increases vehicle miles traveled (VMT).” National Center for Sustainable Transportation, UC Davis (2015)
Yet, the Visualize 2050 section on congestion (p. 85) states:
“Nevertheless, the projects in Visualize 2050 are expected to help alleviate congestion and delay compared to not building any roadway improvements.”
CSG asks that the plan document explain induced demand (p. 67-69, 84-85) to educate decisionmakers and stakeholders.
3. Visualize 2050 fails to achieve the emissions reductions in COG’s climate plan, even with a rapid shift to electric vehicles.

Regional transportation emissions under Visualize 2050
Source: TPB July 2025 presentation, with red annotations by CSG
Carbon dioxide (CO2) pollution from cars and trucks would hardly drop compared to the scale needed. In the chart above, the green line shows forecast greenhouse gas emissions from our road and rail network under Visualize 2050’s mix of projects and adopted fuel efficiency standards. The red line shows the trajectory needed to meet adopted emission reduction targets by MWCOG (shared by most cities and counties in our region) and the TPB’s own 2030 target.
Even if the National Capital region achieves COG’s goal of EVs totaling 50% of new car sales by 2030, the region still needs to shift trips to meet climate targets. How much people drive to meet daily needs, referred to as resident vehicle miles traveled (VMT), would need to drop by about 20% by 2030 and further by 2050, even if we met COG’s EV adoption goal. This is why states like Maryland have set goals to reduce per capita VMT by 20% or more.
Here’s the relatively small progress in reducing car dependence that Visualize 2050 would achieve versus what’s needed:
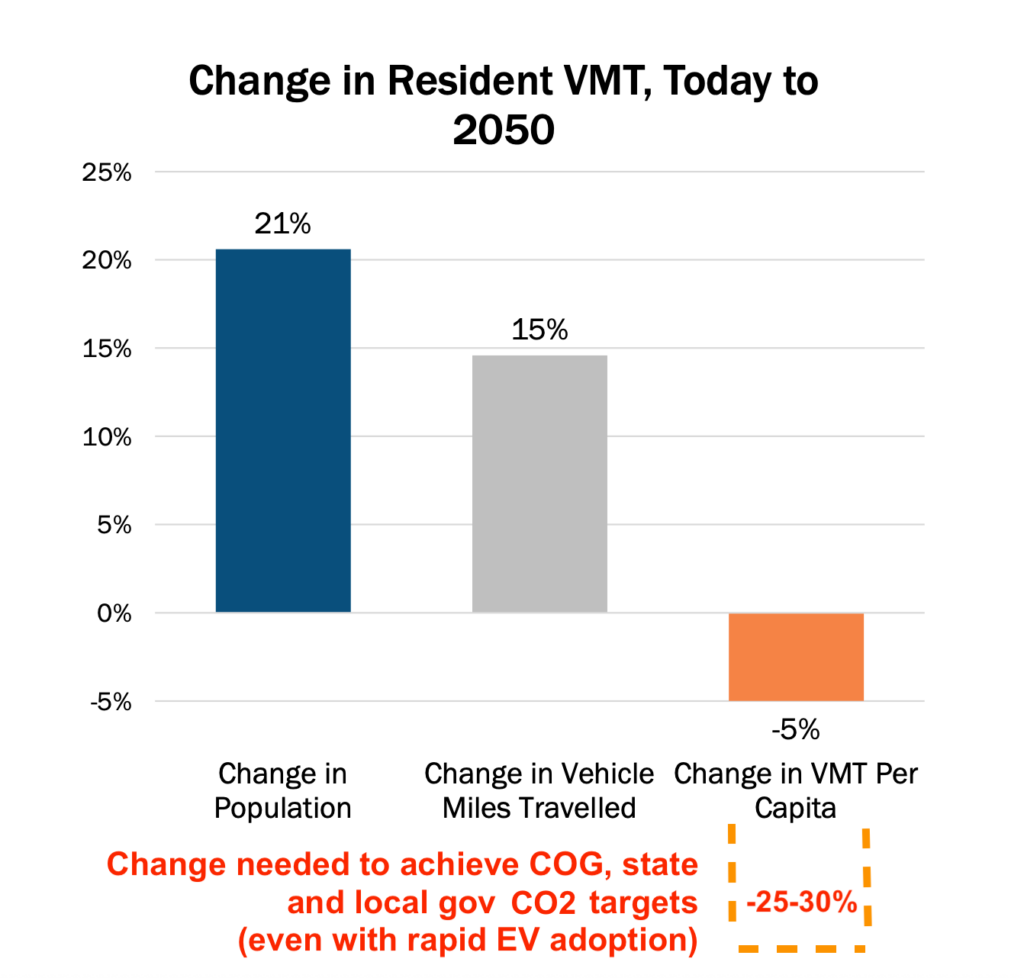
Source: TPB July 2025 presentation, with red annotations by CSG
5. Localities must step up efforts to prioritize housing production and zoning reform along transit corridors and other accessible parts of the region
5A. Even the relatively modest transit-oriented development in official Round 10 cooperative land use forecasts achieves greater job accessibility than the $20-30B in highway and arterial expansion.
- Figure 6.12 shows the region gains 45,000 more jobs accessible by transit in 45 mins. – even without transit expansion – by facilitating new jobs and homes near transit.
- While Figure 6.11 shows that even after spending upwards of $30 billion on highway and arterial expansion, the region has 50,000 fewer jobs accessible by car in 45 minutes.
5B. Region must do more to achieve its adopted location targets for jobs and housing.
CSG recognizes that transportation projects alone won’t achieve our goals. More housing opportunities near transit, jobs and accessible walkable activity centers, and curbing sprawl are essential. There is progress but the region needs to do more to focus housing growth in the right locations:
- Forecasts: 72% of job growth and 63% of the household growth will be concentrated in Activity Centers
- Adopted goals: 75% of job growth and 75% housing growth to occur in Activity Centers and high-capacity transit station areas (Region Forward plan, COG Housing Targets)
Ideally, we need to focus this growth in the Activity Centers that are walkable and transit-friendly.
5C. COG needs to track its housing production with regard to its target that 75% of housing go to transit station areas and activity centers
So far COG has not been tracking its 2019 housing location target. The HAND Housing Indicator Tool tracks the housing production target and the affordability targets, but HAND does not have the resources to track housing permit location. Please ask COG to start tracking this target to provide important data to member jurisdictions.
5D. We appreciate the housing and land use discussions in the document. The sections would benefit by noting the region’s adopted goals versus forecasts.
CSG appreciates the good discussions of housing and land use (pp. 38-39, p. 40, transect diagrams). These would benefit by providing context on the adopted COG housing location target and Region Forward jobs location target versus what’s forecast under local land use plans (see comment 5B above).
6. Public comments repeatedly call for change from the Visualize status quo
According to TPB staff analysis of Visualize 2050 comments received:
2024 public involvement main concerns (893 comments):
- Express toll lanes effectiveness to reduce congestion
- Roadway widenings encouraging more automobile trips, increasing carbon pollution
- Transit projects, not enough being done, not enough soon
- Bicycle and pedestrian projects not included in this list, not enough being done
2023 public involvement overarching themes (997 comments)
- Strong negative sentiment towards roadway widening and expansion projects
- Strong positive sentiment towards passenger rail expansion and improvements, bus improvements, bicycle and pedestrian infrastructure improvements, and BRT projects
- Support for roadway improvements that include traffic calming features but desires for more bicycle, pedestrian, or bus infrastructure improvements
- Advancement toward climate goals” and “reducing car dependence”
The comment results are similar to those received in 2022 and 2021 on Visualize 2045.
Likewise, the 2020 Voices of the Region, a representative scientific survey of the region’s residents, also found that residents are more concerned about climate change than congestion, support bus lanes and more space for walking and biking, and that future generations will thank us more for clean transportation, transit, walking, and biking investments than for wider roads.
7. Additional comments: minor edits, clarifications recommended
- P. 26 – Safety – we appreciate the plan’s overall emphasis on safety. Important context to the reader would be to provide stats on relative safety by mode (e.g., deaths, serious injuries per 1M VMT).
- P. 29 Recommend clarifying the first sentence, which is unclear and could be interpreted to mean the public transit is more dangerous than driving: “Due to the public nature and infrastructure footprint of public transportation, the personal security of transit staff and customers is a more unique challenge when compared to the risks posed in and around a private vehicle.”
- P. 35 first paragraph. Recommend revising this sentence that might be read as saying that pedestrian and bike-friendly road designs necessarily inhibit commercial access. “Street designs commonly found in the region’s more densely populated areas, such as bike lanes and narrower intersections with tighter turning radii, pose challenges for trucks maneuvering turns and can obstruct access for pedestrians and cyclists during deliveries.” A number of communities have successfully created high-quality, safe, walkable, bikeable streets while facilitating commercial access and increasing commercial activity there:
- P. 41 Glad to see the Activity Density discussion. This statement would benefit by being qualified: “Roadways are designed to handle higher traffic volumes” in more urban areas. Oftentimes it’s the opposite: Many auto-dependent lower-density suburban areas have oversized roads compared to livable urban areas. Please note that local jurisdictions and state DOTs also make choices whether they want to provide walkable areas or not – it’s not strictly correlated with density and proximity to the core.
- We appreciate the plan’s statement on p. 86 that gets to this point: “designing the built environment to mostly prioritize vehicle movement and direct car access to land uses has fostered automobile dependency, driving higher fuel consumption and related emissions.”
- P. 50-51 – please replace the inaccurate term Zero-Emission Vehicle. For example, “low-emission” or “cleaner emission” vehicles would be more accurate terms for BEVs. Battery electric and other cleaner fueled electric cars and trucks are critical to climate progress and significantly reduce air pollution compared to ICE cars. However, electric vehicles are still far from zero emission, both in terms of their lifecycle pollution and non-tailpipe pollution.
- P. 59 – Thanks for including discussion of WMATA needs. It would be beneficial for the Visualize plan document to clarify what is assumed in the plan for state of good repair and capital expenditures versus the system needs identified in DMVMoves.
- P. 62 Applying TPB’s Priority Strategies via the Planned Expenditures.
- “Per TPB staff analysis on the sponsor agency responses, all projects/programs included in Visualize 2050 align with TPB’s goals.” – please provide supportive documentation. To my knowledge, this information was not available when the draft list of project conformity inputs were released for public comment and then adopted.
- The TPB FAQs provide a seemingly different response: “With more than 150 highway and transit projects in the TPB’s plan, staff had noted the inability to perform a systemwide impact analysis for every project submitted for inclusion in Visualize 2050.” Please clarify.
- P. 68 The proposed expansion of the Medical Center Drive interchange – as currently designed – is not an appropriate example of a project supporting transit-oriented development and improving pedestrian and bicycle connectivity. CSG and local advocates have asked SHA to fix the oversized road design and use a more appropriate approach (2023 letter).
- P. 69 Express Lanes “By diverting vehicles from the free, general purpose lanes, HOT lanes help facilitate less congested travel on those lanes.” Please cite the source. We’re not aware of publicly available data on existing Express Lanes facilities in Northern VA that backs up this statement. Public officials have asked VDOT for this data on speeds and traffic volumes in general purpose lanes but VDOT has not provided it to our knowledge.
- P. 70-74 We appreciate the good nuanced discussion of rail and bus transit.